|
|
|
Support Resource Center
Chart 31
JFC Real Time Pivot Indicator

Chart 31
|
|
|
Support Resource Center
Chart 31
JFC Real Time Pivot Indicator

Chart 31
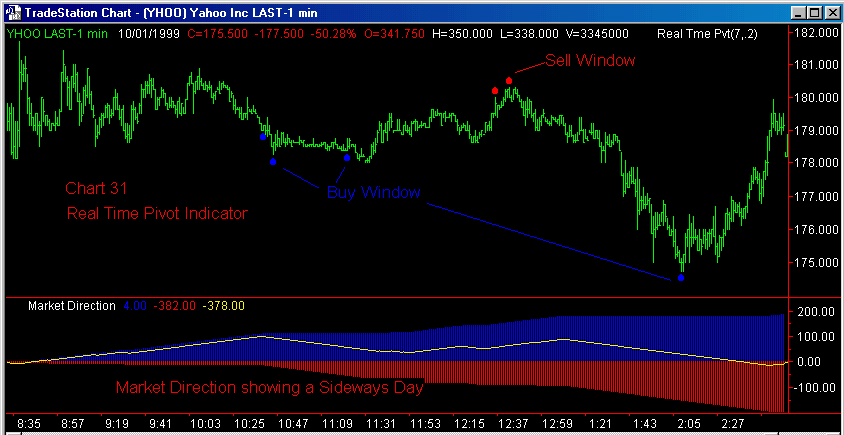
With the JFC Market Direction Indicator signifying a sideways day early in the trading session we will be able to confidently work both sides of the market today on this chart of Yahoo!.com.
Note the favorable market reaction to both the Buy Window and Sell Window identified on the chart by the JFC Real Time Pivot Indicator.

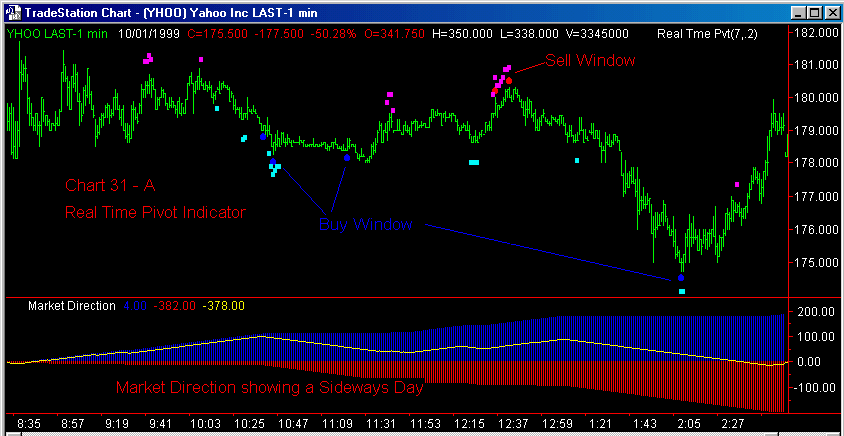
During the video presentation I mentioned that on this chart several other indicators in your package would be giving buy and sell signals in the same area as was being designated by the Real Time Pivot indicator.
On Chart 31 - A above I have added the JFC Reversal Indicator to demonstrate
the signals which would be given by this tool. Note that the signals from
the JFC Reversal confirm the buy and sell windows identified by the JFC Real
Time Pivot indicator.

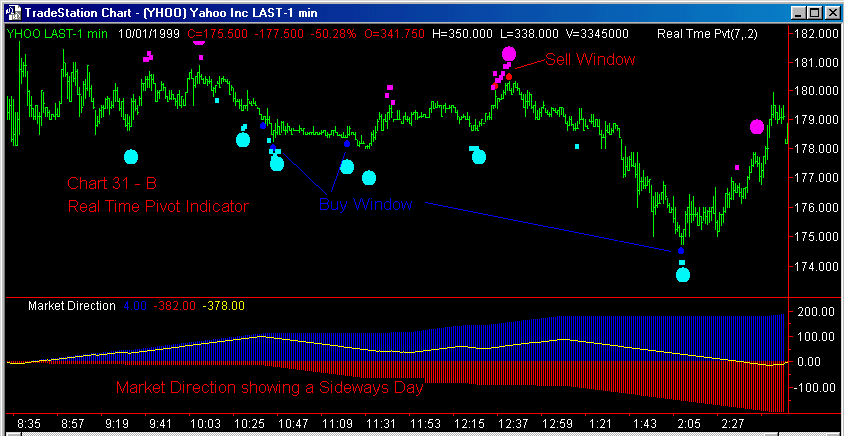
To further enhance the concept of using several indicators in tandem to identify buying and selling windows I have added the JFC Cluster Indicator on Chart 31 - B above.
Note that when all three (JFC Real Time Pivot, JFC Reversal, JFC Cluster)
give an indication of a buy or sell
window at the same time the price reaction which occurs after the
simultaneous indications is indeed of a greater significance that when
the signals are issued by only one program.