|
|
|
|
|
|
Chart 37
JFC Entry Point Indicator
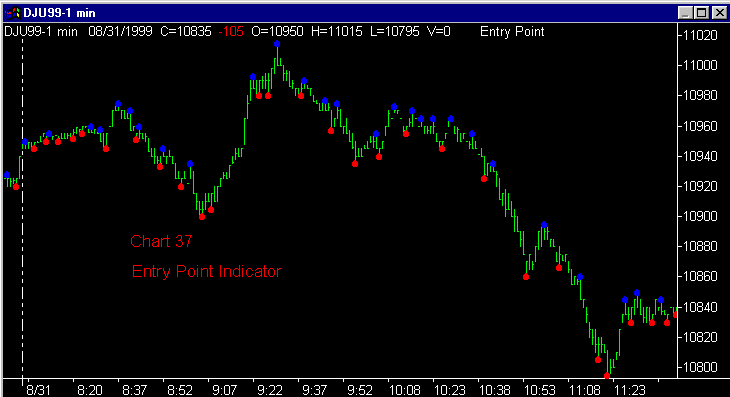
Chart 37
The blue and red
dots on the chart are placed by the Entry Point Indicator.
Support is defined by the small
red dots below the bars.
Resistance is defined by the small
blue dots above the bars.
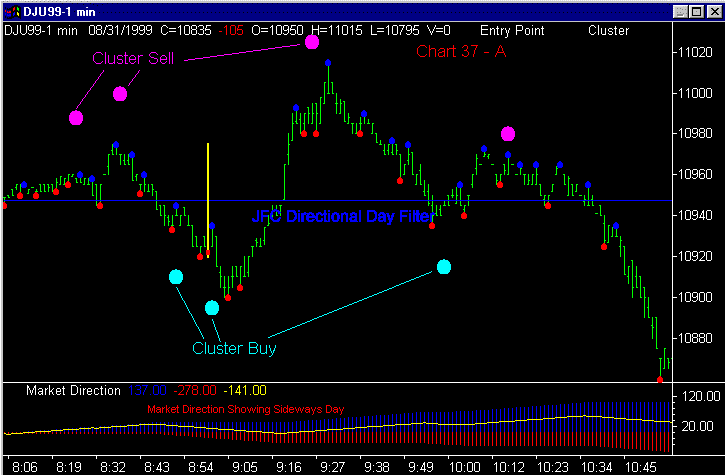
Chart 39 - A adds the Cluster, Market Direction and Directional Day Filter to the previous chart to begin the illustration of the use of the Entry Point Indicator to further define the price at which trades should be entered.
You will notice three sell signals given by the Cluster Indicator and three buy signals given by Cluster on the above chart.
Also of note is the fact that, one hour into the trading day, the Market Direction and Directional Day Filter are indicating a sideways trend for the remainder of the trading session.
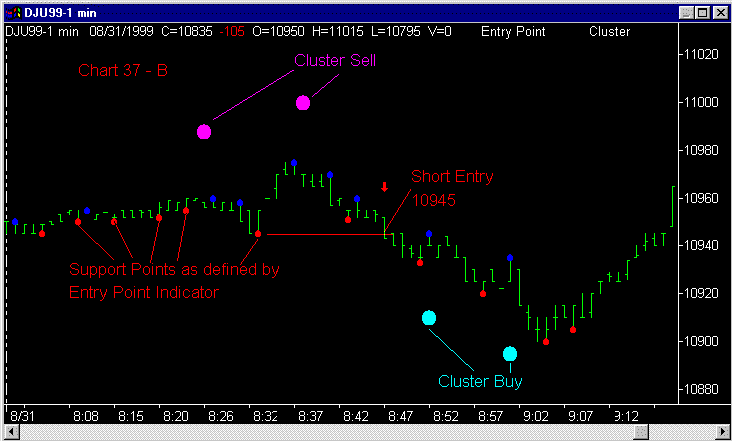
Chart 37 - B isolates the portion of Chart 37 - A which deals with the first two sell signals issued by the JFC Cluster Indicator. You will recall that the JFC Entry Point Indicator identifies support and resistance on price charts which will be used for placement of buy stops above, and in this case, sell stops below the market.
Note the last of the 6 red support dots placed on the screen above. It is here, at the 10945 level, that the sell stop should be placed after receiving the sell signals from the JFC Cluster Indicator. This stop placement is indicated by the short red line projecting to the right of the support point.
We have defined the sell window by the appearance of the JFC Cluster sell signals. Now we will wait for the market to confirm the new downtrend by breaking underlying support.
Nine minutes after the appearance of the last JFC Cluster Sell Indicator the market trades down through support and we have established a new short position.
This entry strategy represents the lowest risk entry scenario. Granted, selling at the first appearance of the JFC Cluster Sell Indicator would have yielded a higher entry price for this short entry. Also, there are two more support points which came in at a higher level which we could have used for a level at which to place our sell stop. Note that these two points are very close to the lows of the adjacent bars for some time. Placing a sell stop this close to the actual market can result in an "accidental" entry should the floor decide to test the recent lows in an attempt to run the market a bit lower to provide themselves with a better buying opportunity. Placement of the sell stop as we have done here is a more conservative approach in that we require the market to violate the short term support that it created earlier before we enter a short position.
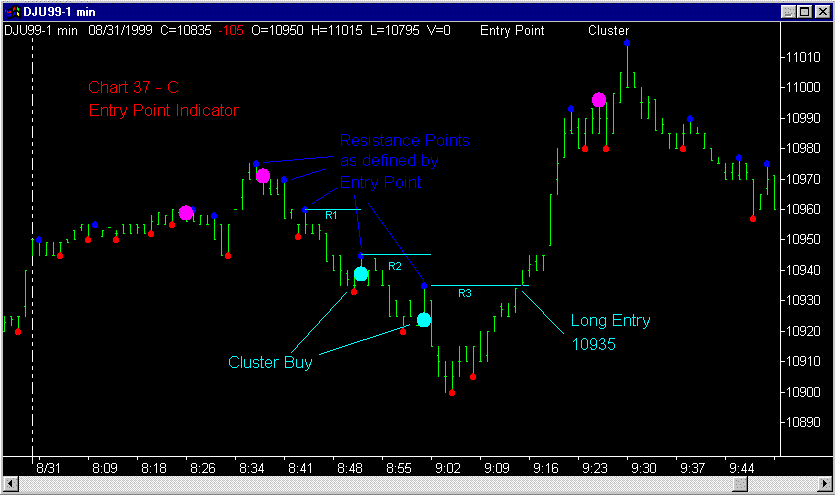
Chart 37 - C details the next important portion of our current chart which shows the completion of a buy signal on the Dow Jones Futures Contract.
Note the two buy signals issued by the JFC Cluster Indicator. Also evident on the above chart are the resistance points defined by the JFC Entry Point Indicator.
When we receive the first we are able to place our buy stop at the last available resistance point, marked by the R1 designation on the short cyan line. Recall from the discussion of the JFC Entry Point Indicator in the accompanying manual that the support and resistance levels are not calculated until at least two bars have been printed past the bar in question. Always keep this in mind when viewing historical charts. In the instance above, the resistance point above the first JFC Cluster Buy Signal designated by the R2 label would not have appeared in real time until the two bars following the signal bar had been formed. Likewise, the resistance point above the signal bar for the second JFC Cluster Buy Signal would be evident on a real time chart until the market was nearly at the bottom of the low point on the chart above, two bars after the designated signal bar.
As the market drops further, we are able to move our buy stop to the short cyan line designated as R2.
After receiving a second JFC Cluster Buy Signal we are able to place our buy stop at the lowest resistance point, designated R3 above.
Note that the long position is taken only after the market has confirmed the change in trend by violating overhead resistance.
As mentioned earlier, this is the conservative, and therefore the safest method of entering the long trade in question. Let's now examine the more aggressive method of trading the above chart and demonstrate the pitfalls of such an approach.
Since we have determined the trend of the day to be higher, in the aggressive mode we could take the first buy signal by the JFC Cluster Indicator and purchase the market when the marked bar is painted on the screen. Note that this purchase would have occurred approximately at the 10945 level for the Dow Futures Contract. Observing the chart, we can notice that the market continues to drop to the 10900 area or slightly lower before reversing and finally moving in the direction favorable to our trade some 12 minutes following our initial entry. It is more that 22 minutes before our position finally becomes profitable after enduring a maximum adverse excursion, or movement against our equity position, of over $450.00.
On the other hand, by entering the market as it violates overhead resistance thereby confirming the new uptrend, we can enter the market, in this instance, and be rewarded almost instantly with a profitable position.
In many instances you can achieve a more profitable position by taking signals as they are issued by the various indicator combinations. By taking this more aggressive posture you may enhance your profit position significantly, but you do so by also significantly increasing the risk factor associate with the trade.
Much of the decision process above will hinge on your own individual trading style and your own specific risk tolerance.
For a more drastic demonstration of the use of the JFC Entry Point Indicator to keep you out of trouble please go to Chart 37-1.
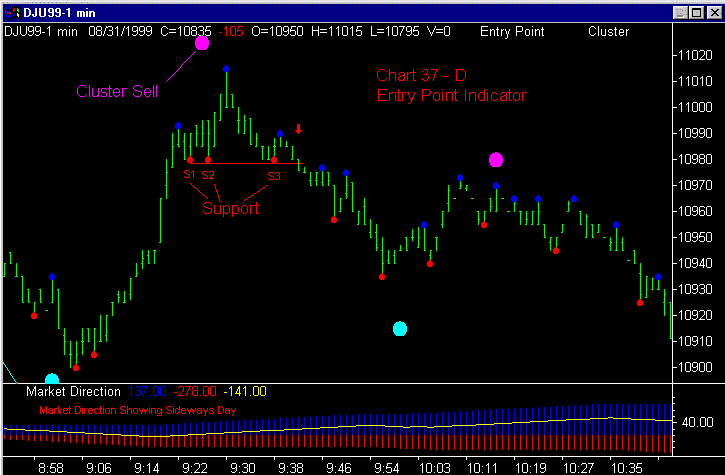
Chart 37 - D further isolates the next section of the same chart of the Dow Futures. Here we are concentrating on the next trading signal formed by the indicator package, a sell signal set up in the 9:20 - 9:40 time frame.
Note the initial sell window which is opened by the JFC Cluster Sell Signal as marked above.
Short term market support is provided by the JFC Entry Point Indicator three different times, labeled s1, s2, and s3, at the same 10980 level. This support is further highlighted by the short horizontal red line on the chart above. The short position is taken when out sell stop just below 10980 is activated by the market as it breaks the defined support, confirming the trend change which was first identified by the JFC Cluster Indicator. The entry into the short position is also marked by a red down arrow on the chart.
Again note that if we had taken the aggressive entry mode for this
trade, we would have entered short at the
first sign of a down trend at the JFC
Cluster Sell
Signal at 10990. We would have had to tolerate 25 points, or a $250.00
move against our position before the trend turned back in the direction
of our trade.
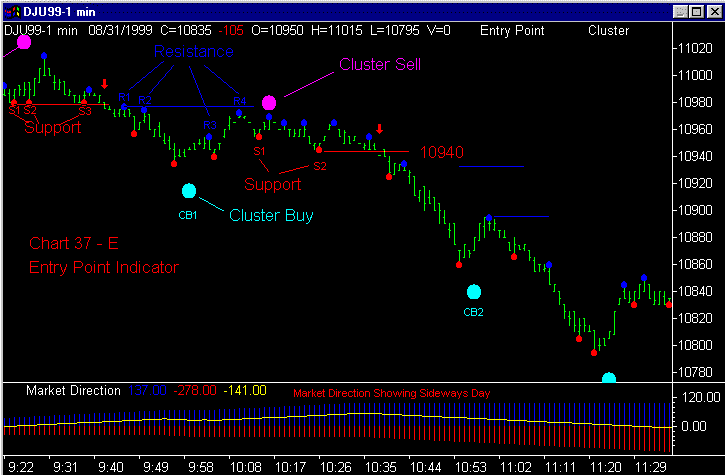
Chart 37 - E describes in detail the next two signals, a JFC Cluster Buy, labeled CB1 above, which was not confirmed by breaking resistance, and a JFC Cluster Sell, which resulted in a short entry of significant proportions.
When the first buy window opened at 9:59 am the resistance levels available for entry were located at the levels of R1 and R2, marked above. This level is further identified by the horizontal blue line at this level.
The R3 point is another instance in which we must realize that this point will not be available on a real time screen until two more bars have appeared to the right of the bar in question. In this instance, the market would be trading through this resistance point by the time it could have been used to place an order, therefore making it relatively insignificant for the chart analysis.
The market-defined resistance point, in this instance, did turn out to be significant resistance as the market did eventually respect this level and turned lower in response to the selling which surfaced as the market approached the 10980 level. By keeping our entry point near this significant resistance point we have avoided getting into a long position with minimal potential for a profit.
Since we are still operating within the confines of a day which has been earlier defined as a sideways day by the JFC Market Direction Indicator and JFC Directional Day Filter Indicator, we will shift our emphasis to the short side of the market when the new sell window opens as defined by the JFC Cluster Indicator at 10:16 am.
Although we could have immediately placed our sell stop at the support level designated by the red dot from the JFC Entry Point Indicator at S1 on the chart above, recall that I prefer to place the sell stop at a point a fair distance from the actual market to avoid the accidental entry when the floor tries to run the stops under the makret. For this reason, I selected the support level at S2 after the market pulled up and away from this level a few bars after the S2 red dot actually appeared.
The actual short entry as defined by your JFC Indicator Package occurs at the 10940 level, as marked by the red down arrow, as the market again confirms a trend change by violating support below the market.
As the market trends lower in the direction of our position, we begin to get buy signals from the JFC Cluster Indicator, marked CB2 on the above chart. When the buy window first appears at 10:57 the resistance level is placed far above the current market at the 10935 area which is too distant to be practical for a new buy entry. When the next resistance point is identified two bars past the next blue dot, one would move a buy stop to this area, which would be either used as a point to exit the profitable short position or enter a new long position if the previous short trade had been exited at a pre-determined target or objective. Note that the market again respects this calculated resistance and continues to trade lower in the direction of the short term trend.
The whole point of this rather extended discussion of the JFC Entry Point Indicator is to place the desired emphasis on the importance of requiring the market to confirm any potential trend change by breaking defined support or resistance in the market.
Using this indicator as described in this section, while in some
cases decreasing the profit potential of the trade, will have the end result
of keeping you out of many, many undesirable trades, and ultimately delivering
a significant effect to the bottom line of your trading statements.