|
|
|
|
|
|
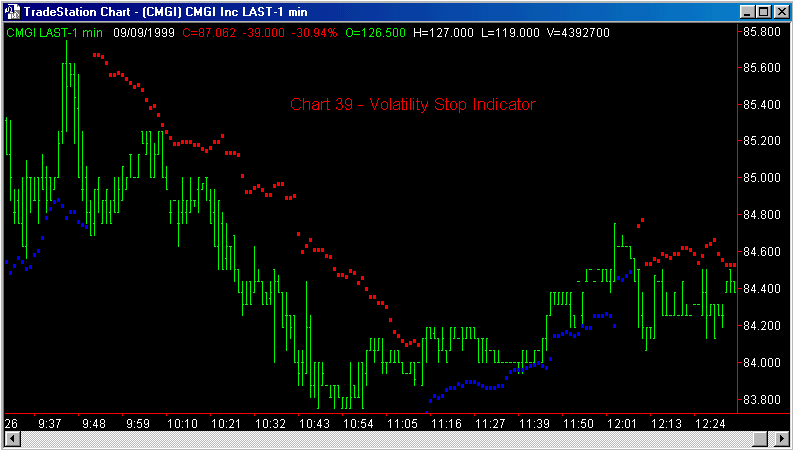
Chart 39
Volatility Stop Indicator

Notice on the chart above how the JFC Volatility Stop Indicator
gives the trader a flexible trailing stop.

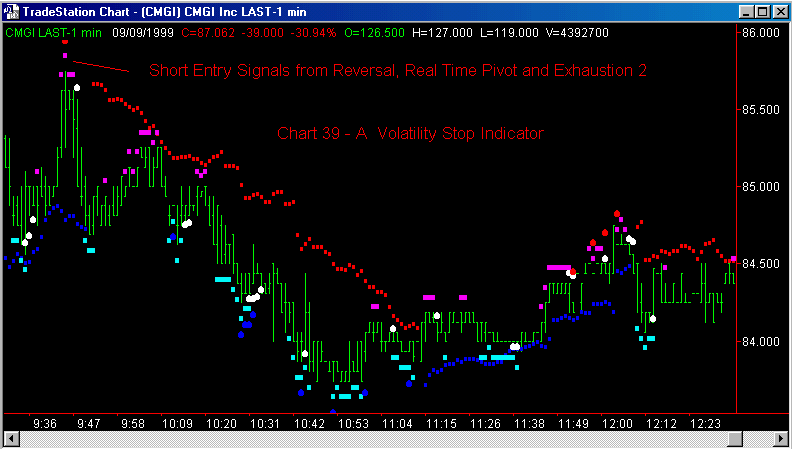
In the chart above, we receive sell signals from the JFC Reversal (small magenta squares) Indicator, the JFC Real Time Pivot (red dot above the bar), and the JFC Exhaustion 2 (white dot) Indicator. As these three indicators all measure exhaustion using their own unique mathematical formula, the appearance of all three signals within a narrow time frame, as pictured above, is a strong sign that a reversal in trend is imminent.
The JFC Volatility Stop Indicator places a trailing
stop (series of small red squares) behind
the market which locks in a greater and greater profit as the market moves
in our favor. The trailing stop finally takes us out of the market near
the low point of the move when the price bars trade up through the red
series.


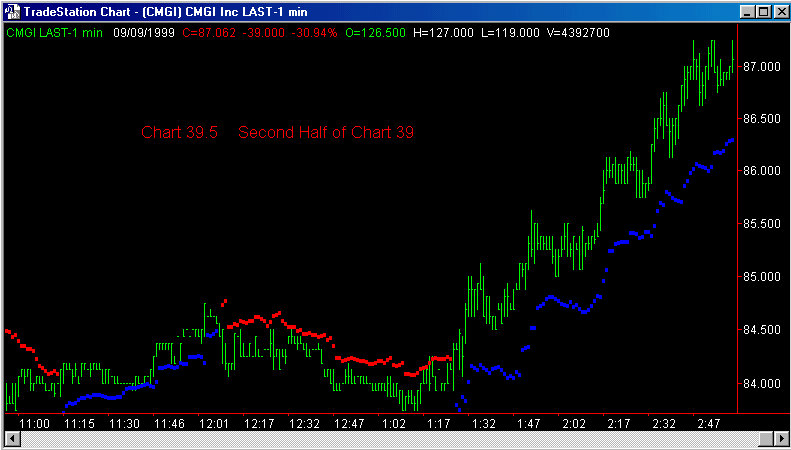
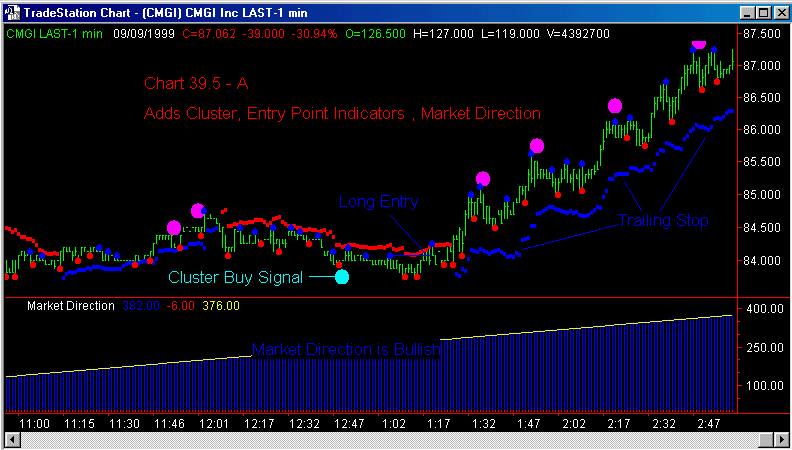
Here is an example of four indicators working together to produce a profitable trade.
As always, with the JFC Market Direction Indicator in a bullish stance, we will only consider the buy side of the market.
First, the buy window is opened by the JFC Cluster Buy Signal, as marked above. The Long Entry, as defined by the JFC Entry Point Indicator (small blue dots above the price bars) is taken at about the $84.00 level. The Trailing Stop as plotted by the JFC Volatility Stop Indicator keeps us in the profitable trade until we exit on the close of the day.