|
|
|
Support Resource Center
Chart 4
JFC Market Direction Indicator

Chart 4

|
|
|
Support Resource Center
Chart 4
JFC Market Direction Indicator

Chart 4

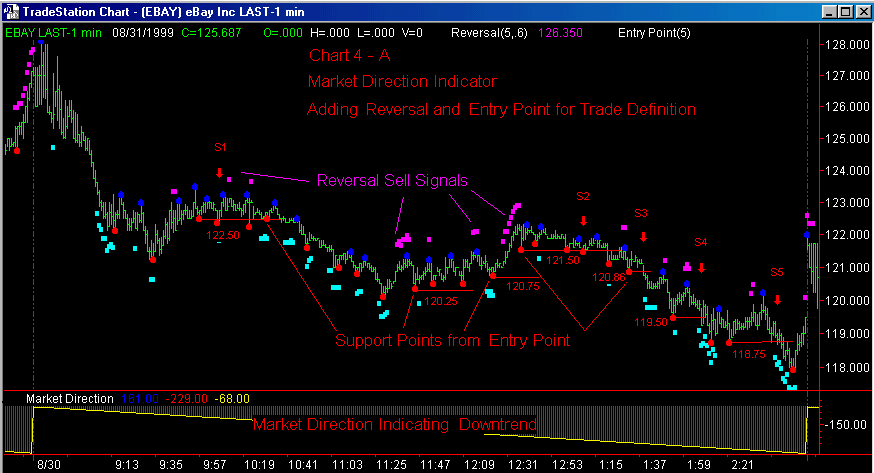
As with Chart 3 - A, the JFC Reversal and JFC Entry Point Indicators have been added to the above chart to define the points at which actual trades would have been taken by using these tools.
At point S1 the short trade was entered at the defined support point of 122.50. The initial sell window was opened by the two small magenta squares several bars prior to the down arrow on the screen. The position is taken when our sell stop is filled as the market trades down through support at 122.50.
The S2 short position was entered after a sell window was opened by the JFC Reversal Indicator when it ceased plotting. Final confirmation of a trend change occurred when the market traded down through our sell stop at 121.50, a level of support as defined by the JFC Entry Point Indicator.
Similarly, additional short positions were taken at points S3 and S4 as support at 120.86 and 119.50, respectively, were violated by market action as the downtrend accellerated throughout the early afternoon. Again, sell stops as determined by the JFC Entry Point Indicator were used for entry. Finally, the last short entry was made when the market made a terminal plunge through the 118.75 support area.
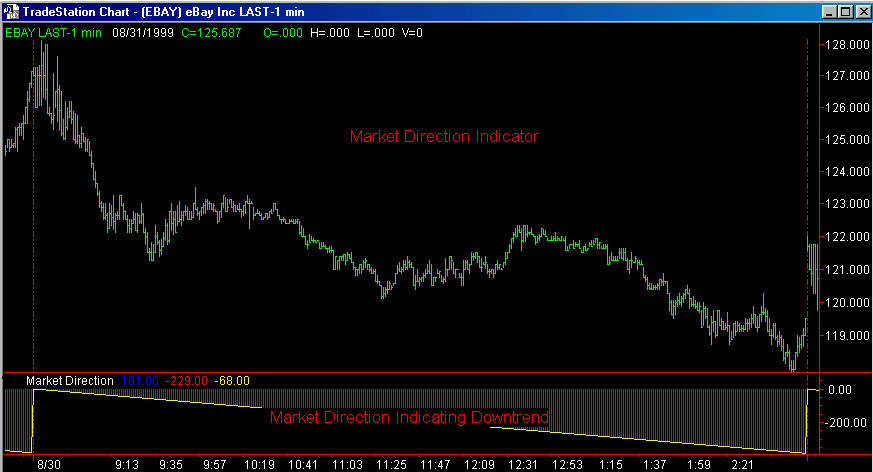
Note that in this final erosion of the market there were multiple buy signals issued by the JFC Reversal Indicator when the small cyan squares ceased to appear. Recal that the JFC Market Direction Indicator had earlier given a downtrending signal for the rest of the day. Consequently, we ignored the buy signals issued later and continued to trade in the diretion of the lower trend.
More Details: JFC Entry Point Indicator JFC Reversal Indicator