|
|
|
|
|
|
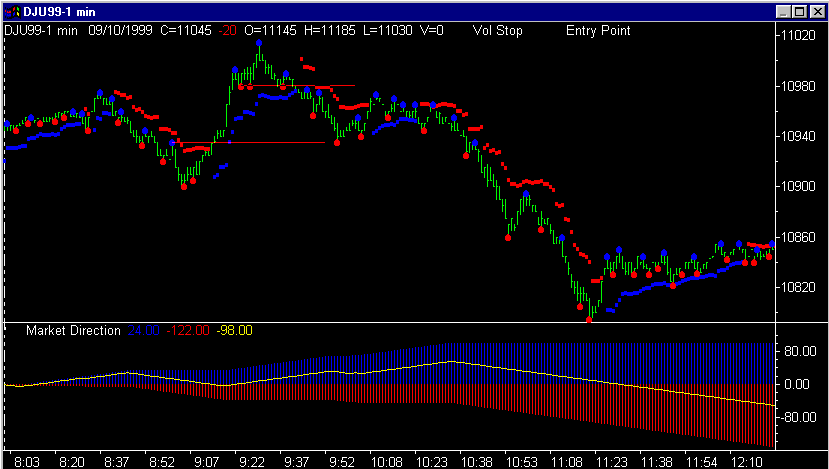
Chart 40
Volatility Stop Indicator

Chart 40

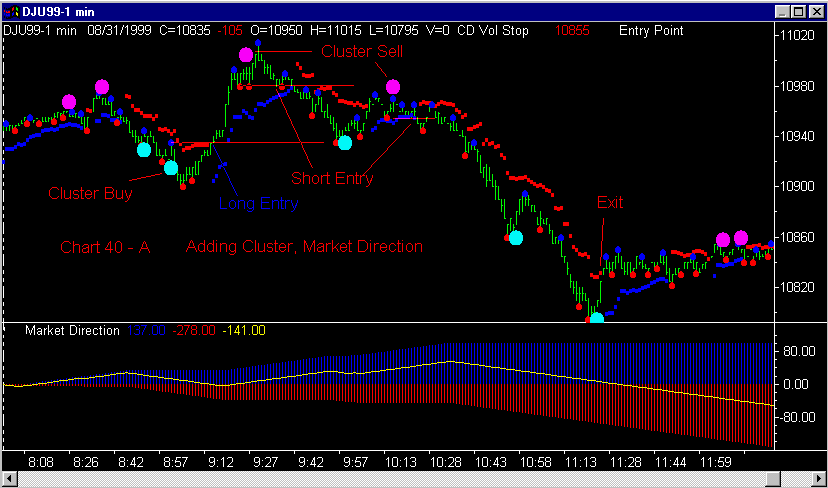
Chart 40 - A adds the Cluster and Market Direction Indicators to Chart 40 to further identify the entry points on this market.
First, note that the Market Direction is indicating a sideways day early in the session, enabling the trader to take positions on both sides of the market during the rest of the session.
The first long entry of the day happens when the Cluster Indicator gives a series of buy signals in the 8:45 - 9:00 area. At this same time the Entry Point Indicator (small blue dots above the price bars) has identified overhead resistance at the high of the bar above the second Cluster indicator. This level is further identified by a short red line extending to the right of the entry point dot.
About 15 minutes later the market trades through this resistance point, confirming the trend change first identified by the Cluster Indicator. Since we have placed a buy stop at the level of the overhead resistance, we have automatically entered on the long side when the market trades thorough our buy stop. This is marked on the chart in blue letters, Long Entry.
The trade will be exited when the price bars cross the blue trailing stop plot.
Interestingly enough, this exit occurs just as the next sell signal is filled from the Cluster Sell Signal above the market. As before, the Cluster indicator has identified a possible market top. The market confirms the trend change by trading down through the support point defined by the Entry Point Indicator at 10980. This level is market by a short red line extending to the right of the red entry point dot.
This trade is exited when the price bars trade through the red trailing stop at the 10965 area.
The best trade of this sequence comes with
the
Cluster again
signalling for a short trade which is entered at the 10955 area. This trade
is followed down by the red training stop
placed by the Volatility Stop Indicator and is exited when the market trades
through the stop at 10835.

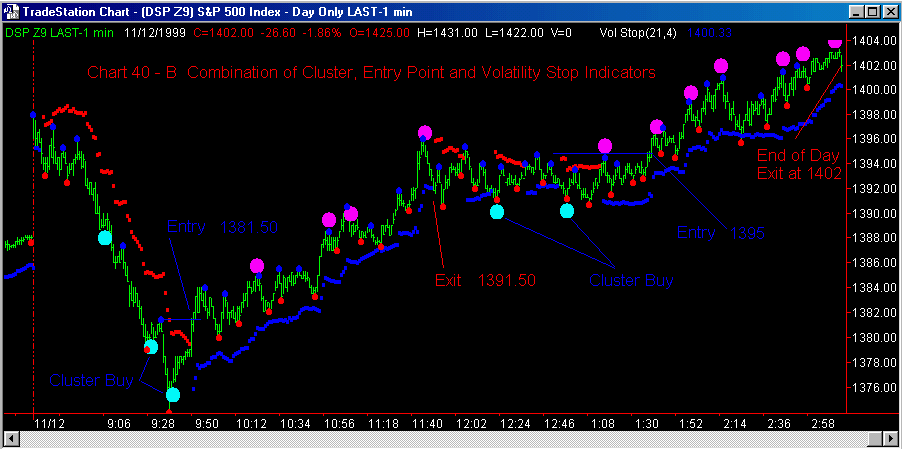
Above please note a chart of the S&P 500 futures contract which shows the manner in which the Cluster Indicator and Entry Point Indicators are used to enter a trade and the Volatility Stop Indicator is used to maintain a trailing stop behind the market and eventually provide an exit point.
The initial buy window opens with the buy signals given by the Cluster indicator between 9:15 - 9:30. The market confirms the new uptrend by trading through resistance defined by the Entry Point Indicator as market at 1381.50. The blue trailing stop keeps us in the market until it is violated at 1391.50, getting out of the trade with a 10 point profit.
The next buying window opens during the noon hour with the two Cluster
signals as shown above, both at the same price level.
Although any of the series of blue entry point
dots would have provided a profitable entry, I chose the highest
of the group since the sideways market which usually occurs during the
lunch hour can easily pick off close stops. When the market trades through
this buy stop at 1395 we are in a new long position.
Again notice the activity of the blue trailing stop as it keeps us in the market until the end of day close at 1402.
More Details: JFC Entry Point JFC Cluster