|
|
|
|
|
|
JFC
Cluster Indicator
The
JFC Cluster Indicator is the last of the group of four indicators which we will
use to further define the short or minor term trend for day trading purposes.
This
indicator is universal in nature and can be used on any bar chart, any market,
any time frame.
Inputs
Due to the complexity of this indicator, the only input provided for this indicator is the PLT input, which sets the location of the plot on the screen. I have defaulted the value here to 1, which places the larger dot we use for this indicator appropriately on most price charts. Greater values entered for the Plt input will plot the dot further from the price bar which is marked by the indicator. Lower values will place the dot closer to the bar in question.
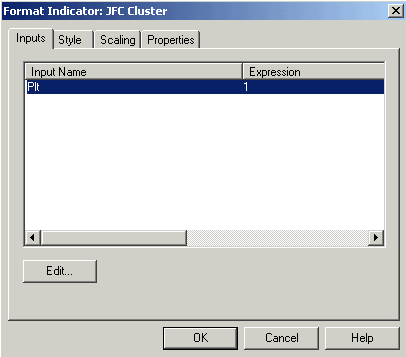
When using this indicator on items which are scaled in 32nds, like the T-Bond Futures Contract, the appropriate setting here would be .05 to observe a similar plot on your screen.
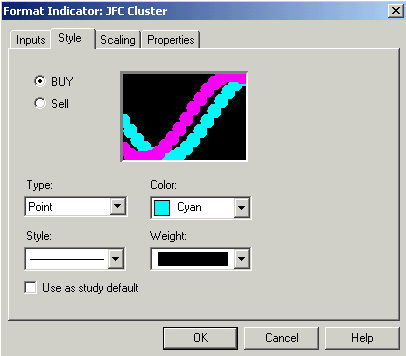
The
Style tab for the JFC Cluster Indicator appears above. The Cluster Buy tab is
defaulted to light blue, or Cyan and the Cluster Sell tab is defaulted to light
red, or Magenta.
Both
tabs are defaulted to Point under the Type setting and the heaviest weighting
possible under the Weight tab. The indicator is so defaulted so that its visual
interpretation can easily be distinguished from other plots on the chart in
question. The dots presented by this indicator are the largest you will see from
any of our tools and are easily spotted on a chart with the above configuration
in place.
There is good reason for the
conspicuous nature of the plots. The JFC Cluster Indicator is often the last
indicator in our group of short term definition indicators to appear, and thus
arguably the most significant.
Since it will regularly be
the final piece of the exhaustion puzzle, it acts as the culmination of the
exhaustion discovery process. Many traders will base their day trading decisions
on this indicator alone. Hence, the unmistakable, unique configuration for the JFC
Cluster Indicator Plot.
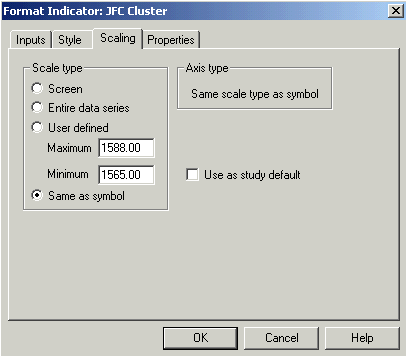
The JFC Cluster Indicator should have its Scaling tab set to Same as price data. Other available settings, while useable, will result in a plot which will be considerably more difficult to interpret.
Properties
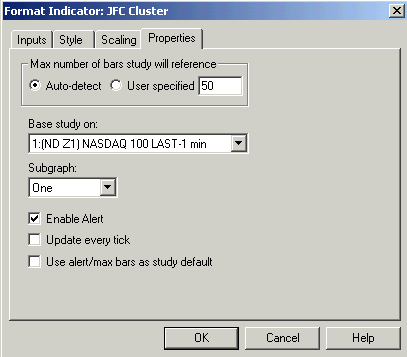
The JFC Cluster Indicator
should have the Properties tab set as shown on above.
There
is an alert programmed into this indicator which will call attention to the
chart in question each time a buy or sell plot is formed.
As
mentioned previously, the JFC Cluster Indicator will usually be the last piece
of the short term trend definition process to surface on your trading charts.
Large,
light blue points below the price bars are an indication that the downside move
currently in progress has indeed neared its exhaustion point. At this time,
serious consideration should be given to turning to the JFC Entry Point
Indicator for an appropriate buying point.
Large,
light red points above individual bars signify that the current upside move is
nearing its final exhaustion phase. One should immediately get a reading from
the JFC Entry Point Indicator in anticipation of a pending entry into the short
side of the market.
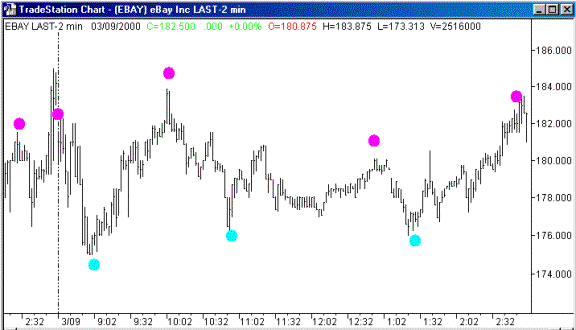
The
chart below is a two-minute chart of E Bay from March 9, 2000. Note the
placement of the large dots above the price bars, which signify selling points.
These sell plots will appear as Magenta, or light red, on your actual computer
chart.
The
dots below the bars, which signify buy windows, will appear as Cyan, or light
blue, on your actual computer chart.
This
E Bay chart is demonstrating sideways price action, notice the location of the
various buy and sell signals generated by the JFC Cluster Indicator. This chart
is a good example of how this indicator can help the trader work both sides of
the market on such a day.
We
would also like to mention that is quite typical performance for this indicator.
The input settings for this indicator were NOT optimized or adjusted in order to
create an “attractive” chart for this manual. Rather, when creating these
manual charts we simply selected a few examples from the last few trading days.
This
E Bay chart is also an excellent example of how a trader can use the JFC Cluster
Indicator as an Exit tool.
Take
the sell signal at the high of the day for instance, using JFC Entry Point as an
entry (not shown on this chart) the JFC Cluster Buy signal, immediately after
this sell signal at the high, could be used as a exit signal.
When
using this indicator on your own trading charts we encourage you to explore its
use as an exit tool. You may also view the Four Steps Trading Course videos to
gather additional ideas about using JFC Cluster as an exit tool.
The
chart below of AOL taken from the same day as the E Bay chart demonstrates
similar buy and sell windows as calculated by the JFC Cluster Indicator.
Again,
note the placement of the buy and sell windows as plotted by the JFC Cluster
Indicator.
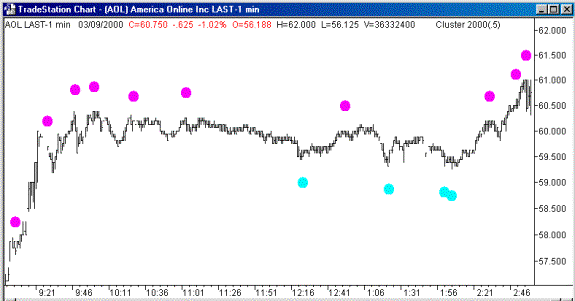
This
is an excellent chart to once again emphasize the usefulness of the JFC Cluster
Indicator as a filter for actually entering a trade. Although each individual
buy and sell signal as calculated by the JFC Cluster Indicator are not placed at
the exact prime swing high or low, use of the JFC Entry Point to place buy stops
above and sell stops below the market would have created excellent trading
opportunities.
This
identical chart is also used in the manual section explaining the JFC Entry
Point Indicator. In that section we demonstrate how JFC Cluster and JFC Entry
Point can be used in combination to prevent entering bad trades.
The
section explaining JFC Entry Point Indicator will illustrate the comparative
advantage of using support and resistance points as an aid in actual trade
entry.
Please
Note:
Do
not allow the comparative lack of discussion about the JFC
Cluster Indicator to diminish the relative importance of this indicator.
This
is the most complex program of the entire software package, performing nearly
15,000 calculations for each price change.
Its
method of identifying short term exhaustion is arguably the most intensive and
complete of the four minor
trend tools, thus making it the
last of the group to usually appear.