|
|
|
|
|
|
JFC Directional Day Filter Indicator Manual
The JFC Directional Day Filter Indicator is the second of the two indicators which we will use to define the dominant, or major, trend of the day.
Since it is designed as a day trading tool, this indicator is programmed to work only on intra-day data. It will not work on daily data.
Install the indicator onto your chart as described in the General Installation Instruction section of this manual.
There are two inputs for the JFC Directional Day Filter Indicator, Plot Time and Delay.
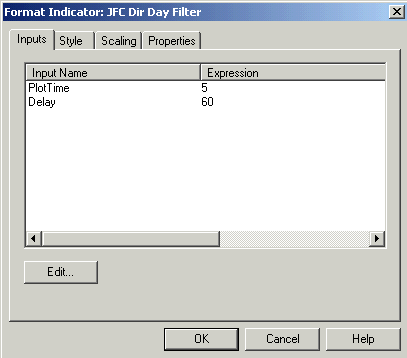
The Plot Time input will determine at which time the first calculations of the indicator will take place. Since the indicator is primarily designed for use on a one or five minute bar chart, the Plot Time input is defaulted to 5, which will let the indicator plot properly on a one or five minute chart. If one should wish to use the indicator on a 2 minute chart the input should be changed to 4 or 6. If a three minute chart is being used the input should be changed to 3 or 6. Set the indicator to 4 for use on a 4 minute chart .I would not recommend using the indicator on charts with a data compression of greater than 5 minutes.
The delay input will determine the time at which the indicator interpretation will occur. With the delay value set to 60, as shown above, the signal bar will appear on the chart 60 minutes after the open of the market in question. Setting this input to 75 will draw the vertical signal bar 75 minutes after the open of the market. CAUTION: This input must be set such that its value is an even multiple of the data compression on the chart. At the time of the plotting of the signal bar, there must be a bar at that time on which the plot is drawn. For example, let’s say for some reason you wish to draw the signal bar 63 minutes into the market day. You would need to plot the indicator on a 3 minute bar to get an accurate plot. (63 / 3 = 21) This 63 minute setting would not work on a 5 minute bar (63 / 5 = 12.6).
My research has shown that values as low as 30 and as high as 90 may be used for this input to give reliable determinations of the major trend. For the highly volatile S&P 500 futures market one may wish to use a value as high as 120 to allow for the extreme movements which can be experienced in this market.
You may change this input to a value of your choosing by clicking on the input value to highlight it and then clicking on the edit button below the white box. This will bring up a box in which the number may be entered. Click OK to return to the setup screen above.
The Delay input is defaulted to 60 as this is the most reliable setting for most active commodities and stock issues.
It
is important to note at this point that there must be a bar on the chart with a
time value equal to the open of the market plus the delay time for the indicator
to plot on the screen. For instance, if a market opens at
There are four style settings active for this indicator, as shown below.
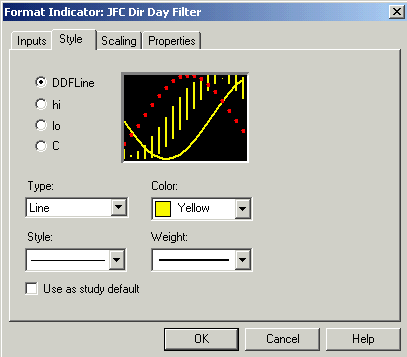
The style tab for the JFC Directional Day Filter will set the color for the horizontal plot which is the actual line used for reference through the day. This line is defaulted to yellow, as shown above.
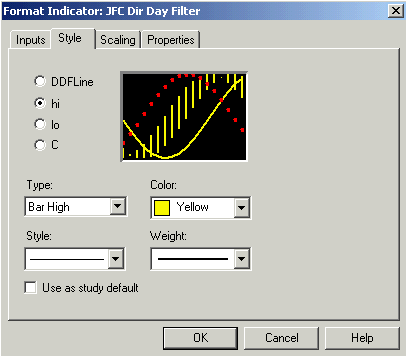
The “hi” and “lo” tabs on this style screen are both set as indicated above. It is very important that the “hi” tab be set to “Bar High” under the Type heading. The “lo” tab must be set to “Bar Low”.
Do not change these settings. If these settings are changed the indicator will not work or plot properly. The color is selectable by the user under the Color setting. This setting is defaulted to yellow but may be altered to any color.
The “C” tab on the style screen, as shown on the following page, should be set to Point under the Type heading. Also notice that under the Weight heading the selection is set to a heavier plot. These two settings will regulate the appearance of the close on the signal bar.
It is recommended, although not required, that these settings not be changed. The color of the plot may again be selected by the individual user.
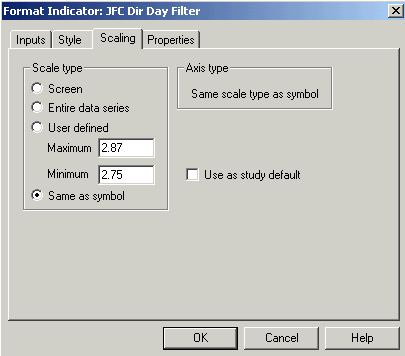
It is critical to the proper performance of this indicator that the scaling always remains set to “Same as price data”. Do not change this setting as it will result in a screen plot which is totally useless.
The numbers which appear in the Maximum and Minimum boxes are not active with the scaling set to Same as price data and may be ignored.
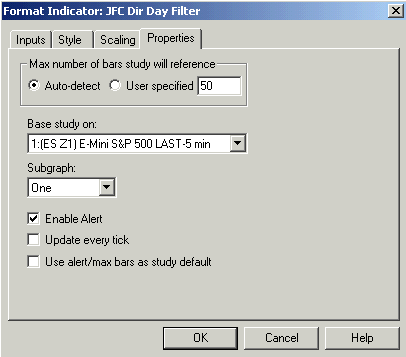
The properties screen should appear as above. The Auto-detect button should be selected as shown.
Under the “Base study on” heading you should see the symbol of the data which is applied to the chart along with the time frame being used. This screen shows that the indicator is being used in subgraph one on a one minute chart of the December, 2001 E Mini S&P Contract.
Always be sure that the indicator is placed in subgraph one, as designated under the Subgraph heading. Plotting this tool in any other subgraph will severely compromise if not totally eliminate the effectiveness of the indicator.
There is an alert programmed into this indicator. Checking the “Enable Alert” tab as shown on the previous page, will allow this alert to operate. Should you not wish to have this alert appear on your trading screen you may remove the check from this box by clicking on the Enable Alert item.
With the alert enabled, the indicator will also place an alert box on your screen when the vertical signal bar is plotted on your trading screen.
This alert can be used to a distinct advantage during your daily trading activities. You will likely be following multiple stock issues / commodity contracts as a part of your normal day. You might choose to have the signal bar portion of the JFC Directional Day Filter Indicator set to plot at different times for each chart being analyzed. The daily major trend identification as calculated by the JFC Directional Day Filter is a very critical determination which will impact your trading decisions for the remainder of the day - thus it is important that the market in question be analyzed at the proper time.
Enabling this alert will allow TradeStation to tell you automatically when it is time to go to a specific chart and make this critical determination.
You
can then go to the chart itself or go to the
The JFC Directional Day Filter, like the JFC Market Direction Indicator, is used to determine the major trend of the day.
Again, I cannot emphasize enough the importance of specific daily
trend direction. It is the objective of this tool, along with the previously
discussed JFC Market Direction Indicator, to aid you in this critical
determination.
All of the comments listed under the “objective” heading in the previous section of this manual which covers the JFC Market Direction Indicator apply equally to the interpretation of the signals from the JFC Directional Day Filter Indicator. The reader is encouraged to again review these comments concerning the importance of the determination of the major trend early in the market day.
The JFC Directional Day Filter Indicator will appear as three separate components when plotted on your trading screen.
First and foremost is the Directional Day Filter itself, which appears as a horizontal line plotted across the entire length of the screen. The color of this line is defaulted to yellow but may be changed at the discretion of the user.
You will also observe a larger, thicker yellow vertical bar and a red dot plotted on the chart. These two plots make up the signal bar portion of this indicator. This bar is programmed such that the low of the signal bar is the low of the trading day so far into the session. Likewise, the high of the bar is equal to the highest price achieved thus far in the day by the issue / contract in question.
Since a significant portion of the trading strategy covered in this course, both in the indicator section and in the section which discusses the automated SPECTRUM trading system, involves the concept of range expansion, the signal bar associated with the
JFC Directional Day Filter Indicator is a valuable tool which will give the user a quick visual aid as to the bounds of the early range of the day. Also, as the day progresses, one is quickly able to visually determine on which side of the early range the expansion has occurred. One may also use the JFC Intraday Hi Lo Indicator, detailed later in the course, to observe and quantify new daily highs and lows as they are plotted through the trading day.
The red dot which is plotted on the signal bar is significant in that it marks the close of the signal bar. The significance of this close is discussed below.
You will recall that there is a single input, delay, associated with the JFC Directional Day Filter Indicator. The setting for this input will determine the placement of the vertical signal bar. If this indicator input is left at the default value of 60 the signal bar will appear 60 minutes into the trading session. It is at this time that you will make your initial evaluation of the trend for the remainder of the day as dictated by this indicator.
The interpretation of this tool is a visual observation of the activity of the market around the Directional Day Filter at a predetermined time of the day. The time at which this determination is made will vary with the volatility of the issue being examined and with the individual trading style of the user. As mentioned above, this time will usually fall between 30 and 90 minutes after the open of the market, with 60 minutes being the default value. Occasionally values up to 120 minutes may be appropriate.
If the majority of the activity of the market is above the Directional Day Filter at the time of the signal bar the probabilities are high that the trend will have an upward bias for the remainder of the day.
If the action of the market is mostly below the Directional Day Filter when the signal bar appears then it is likely that a downward bias will dominate the market for the remainder of the trading session.
I would like to stress here that major trend definition pointed out by this indicator is strictly a visual one and that no mathematical calculations have been applied to this tool as an aid to its interpretation. This is an indicator that the trader will learn to use after careful observation of the behavior of the above patterns with respect to the trend which then develops for the rest of the day.
There will obviously be days during which it will be difficult to determine on which side of the line the majority of the activity has occurred. When the trader sees one of these days appearing he / she can be more confident of a sideways trend for the day.
Obviously, one will consider the second portion of this indicator and the JFC Market Direction Indicator as well when making this critical determination.
Signal Bar
It is of equal importance to observe the characteristics of the signal bar when interpreting this indicator.
At the time it is painted on the chart and the alert is activated, observe the position of the close of this bar as designated by the red dot on the bar.
If this close is above the yellow Directional Day Filter bar, expect a rally day to follow. On the other hand, should the close be positioned below the yellow Directional Day Filter a down trend can be expected. As with the amount of activity as it relates to the Directional Day Filter, a red dot on the signal bar in close proximity can be regarded as indeterminate, after which a sideways day can be expected.
Thus we have two separate, but related, methods by which we will determine the trend for the remainder of the day using the JFC Directional Day Filter Indicator.
First, we visually determine the amount of total market activity
above and below the Directional Day Filter.
Secondly, we note the position of the close of the signal bar in
relation to the Directional Day Filter.
There will be many days when the interpretation of the trend for the day will be obvious. If nearly all the activity of the market prior to the appearance of the signal bar is above the Directional Day Filter and the close of the signal bar is far above the line the trend of the day will clearly be higher. If the majority of the market action has occurred below the Directional Day Filter and the close of the signal bar is far below the line it will be obvious to the trader that a lower trend can be expected for the remainder of the day.
Other interpretations of the outputs of this indicator are not as obvious as those discussed above. While most of these interpretations will distill down to the declaration of a sideways action for the remainder of the day, there are subtle interpretations, some of which involve also the outputs from the JFC Market Direction Indicator, which can lead to a declaration of a sideways day with an upward bias or a sideways day with a downward bias.
The chart on the following page of the S&P 500 futures market depicts a sideways day as indicated by both the JFC Market Direction and JFC Directional Day Filter Indicators.
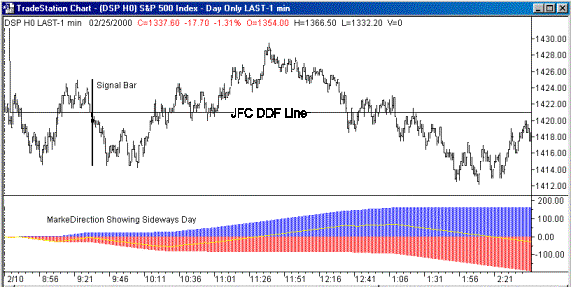
Note that at the point in time marked by the signal bar that the amount of market activity prior to the signal bar was fairly well distributed above and below the Directional Day Filter. Also note that the close of the signal bar is slightly below the Directional Day Filter. Both of these observations clearly lead to the determination of a sideways trend for the remainder of the day, one in which the trader can be comfortable in taking trades on both sides of the market.
Also note the pattern developed by the JFC Market Direction Indicator. The pattern on this chart is quite typical of the display which will be observed on a sideways day in the market.
Additional Signal Bar Observation
Another observation relative to the signal bar can also give us additional information for our trading activities for the rest of the session.
You will immediately notice that the high and low of the yellow signal bar correspond exactly to the daily range boundaries at the time of the appearance of the bar. As you will also notice as you proceed through the course we place a great deal of emphasis on the concept of range expansion both for the assessment of the intra-day market and the placing of specific entry points for overnight position trading.
Refer to the manual section regarding the Spectrum System for additional details on the use of range expansion in position trading. The signal bar portion of the JFC Directional Day Filter Indicator is a convenient tool for the immediate visualization of the bounds of the daily range at a particular point in time.
Examine the length of the signal bar relative to the size of the bar for several preceding sessions. The day trader must have movement, and preferably range expansion, throughout the day to provide sufficient activity for a successful trade.
Since the signal bar marks the high and low of the day prior to the time it appears, a signal bar which is significantly larger than those preceding it may be telling us that at this point in time most of the energy of the market may have been expended and there may be very little more movement expected in today’s market as compared to the past several days.
This concept can be particularly useful if your trading style involves the use of early range breakouts. In this type of trading, we are dependent on significant movement in one direction beyond the early range of the day to generate a significant profit.
Logic tells us that if most of the energy of the market, as compared to previous trading sessions, has been expended, the chances for the type of range extension we are looking for may have a lower probability than on days when the signal bar is telling us that the early intra-day range is closer to the average of the preceding days.
The Directional Day Filter can also function as an important support and resistance line later in the day.
Frequently, after the long term trend for the day has been established as a function of the amount of activity above or below the line, the market will return to the Directional Day Filter, briefly test it as support or resistance, and then turn back in the direction of the major trend for the day.
The following chart details an example of the JFC Directional Day Filter providing resistance on a 5 minute Treasury Bond chart.
Note that after the signal bar formation the market makes multiple attempts to penetrate the resistance provided by the Directional Day Filter before continuing lower later in the day.
This chart also is valuable in that it demonstrates one of the many combination interpretations which can be derived from the use of the JFC Directional Day Filter and JFC Market Direction Indicators to define the trend of the market for the remainder of the day.
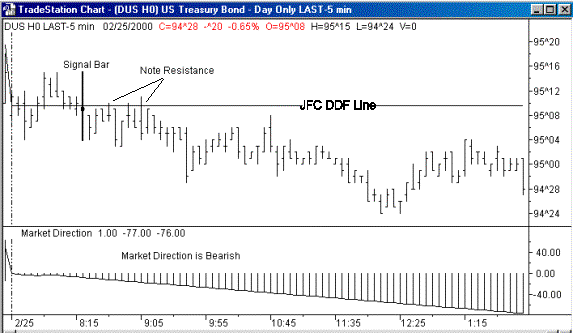
Note that the JFC Market Direction Indicator is indicating a lower trending day from the outset while the conventional interpretation of the JFC Directional Day Filter Indicator can at best be described as sideways to lower. Therefore, combining the outputs of these two indicators, one can label the trend for this day as sideways to lower with a bit more of a downward bias than would normally be expected on just a sideways to lower day.