Dr. John F. Clayburg
Creating Self-Adaptive Trading Systems using
Parallel User Functions
TradeStationWorld
Session
Self Adaptive System Slide Presentation
Use this link to download the free Self Adaptive System
presented at TradeStationWorld
Self-Adaptive Systems EasyLanguage
Code and Free Indicator Trial
Contact
Information
.......
"Self Adaptive
Systems"
A "Self-Adaptive
System" is quite simply one that has the internal ability to dynamically
alter its analytical equations in real time to more closely adapt the system to
ever changing market conditions. The systems accomplish this task by the
diligent application of parallel functions.
What makes Parallel User Function driven systems unique?
Recall the old college days, just after that chemistry exam when you realized
you should have spent more time reviewing the section on oxidation and reduction
and less time on electron shell configuration? Or after the English exam when
you found the test emphasis on sentence construction rather than proper pronoun
usage, which you had spent all night studying?
How about that last trade, when just waiting a few more minutes for your entry
or exit would have turned the result into a profitable experience rather than
another one of those annoying losses?
Obviously, its not possible to turn the clock back and alter previous
decisions. However, we have all, hopefully, over the years, learned from our
previous experiences and have become better traders as the result of this
learning process.
Parallel Function Technology operates in much the same fashion as our own
learning process. While there is no computer in existence, or even on the
horizon, which can come close to the analytical capability of the human mind, we
can, with our Parallel Function Technology, enable our trading systems to learn
from their past experiences and become more effective as a result.
The ultimate objective of all trading is to buy the low and sell the high. As
you know this is much easier said that done. In fact it is, in all likelihood,
altogether impossible. It is possible however to buy and sell in areas where
price action determines that the trade has a higher probability of being
profitable rather than losing.
In this attempt, our Parallel Function based systems are always trying to
identify optimum buy and sell areas. If the identification of this buy and sell
area can be improved upon, the system recognizes this fact and will
self-adapt to take this new understanding into account the next time a
similar market situation arises.
For example, lets consider a trade placed by the Universal System. A
set of specific mathematical equation is used to calculate all trading
signals.
Obviously, all the signals from this system are not perfect. In many instances,
moving the entry point forward or back a few bars would improve the quality of
the signal issued by this trading tool.
Using historical data, we can easily determine the top or the bottom of the
price move where the placement of our buy or sell signal would have been
optimally placed.
The system component of our Parallel Function programming examines the
relationship of all the orders placed over a given period of time and compares
the placement of the signals to what would have been the perfect placement of
each order. The computer program then makes alterations to the base system
equation in an attempt to more accurately place the proper buy and sell signals
as they are issued by the system when similar chart patterns present themselves
in the future.
One might ask, at this point, with the self-adaptive nature of this system
discussed above, why all the signals arent always perfect after the
examination of an adequate amount of past data. The best answer to this question
requires a more detailed examination of the forces that are responsible for the
creation a price chart.
Price charts are ultimately the expression of random human behavior in the
market place. Much of this random activity is largely the result of analytical
inputs, such as supply and demand, earnings and other hard numbers which are
objective in nature and can be analyzed mathematically. The balance of the
origin of market behavior is the result of human emotion, intuition and other
non-analytical data and therefore much less repetitive and much more difficult
to analyze from an objective approach.
It is relatively simple to analyze, from a mathematical perspective, activity
which arises from the repetitive activity generated by hard data.
It is quite difficult, if not impossible, to objectively analyze and therefore
predict the subjective result of emotion and intuition.
Ultimately, therefore, it is mathematically possible to only predict a portion
of the activity which goes into the creation of a price chart. In a sense, you
are always shooting at a moving target from a mathematical standpoint, thus
markedly decreasing the accuracy of perfect market prediction.
However, with all of the above qualifications, the Parallel Function Technology
which drives all of the Systems offered on this site has been shown by our
research to be much more responsive to the ever changing conditions of todays
active markets than the standard indicator packages which use fixed mathematical
processes to calculate their respective buy and sell signals.
Background
It is a common observation of
experienced traders that markets are a constantly evolving, ever changing
dynamic. A myriad of fundamental factors as well as random human behavior
cause markets to constantly change their basic characteristics. After all, a
price chart is nothing more than the graphical description of the
multiple factors that effect prices.
The creation of automated
trading systems is often compromised by these changing market conditions.
The challenge then becomes one of designing systems that are, in one
fashion or another, able to change their characteristics automatically
in response to frequent market changes.
Presented here is a relatively
new concept in automated system design that enables a system to dynamically
alter its internal equations to more accurately keep page with the ever
changing landscape of today's active, volatile markets.
Introduction
This presentation is designed to detail an additional tool which
can be used to make trading systems more self adaptive and therefore more
responsive to current market conditions.
If a system uses back data in any manner it can be regarded as
being self adaptive to one degree or another. Moving averages, standard
deviations, breakouts, neural networks, etc. all rely on some historical
price movement to generate buy and sell signals.
This programming technique takes the self adaptive concept one
step farther by using the system itself to adjust its own trading parameters
for each trade.
I wish to emphasize at the beginning that this is a programming
technique which must be applied in a different manner to each and every
system on which it is used. It is not a canned function or add on program
which can be applied to any system.
Also, since the programming involved in the application of this
technique can be quite involved and extensive, it should be emphasized
that this is not a fix - all for mediocre or poor systems. In fact, it
will probably worsen the results of a poor system since the variables will
constantly be reset to extreme values, making the equity swings of the
system even more pronounced.
Systems which respond best to this technique are those which
are considered robust in nature and remain profitable over a progressive
set of input variables. Such a system should show a bell curve pattern
when the results of an optimization over the critical inputs is performed.
Systems which respond well to frequent optimization will find this technique
useful in improving performance and smoothing out equity curves.
Back Test Regular Optimization
Traders and system developers regularly check variations of their
system against recent back data in an attempt to discover if an underlying
change in the market has effected the performance of their system. Done
properly, this effort can be rewarded with improved system performance
real - time. Improperly done, which is more often the case, frequent re
- optimization leads to a system which is overly curve fitted and more
prone to losses.
The difficulty is knowing how often to optimize, over what system
parameters and how much data should be used for each test. To come up with
the correct testing parameters is a time consuming operation since there
are so many variables to consider. Also, if the testing is to be accurate,
a fairly large volume of past data should be considered.
Through the use of parallel functions, one can set up a group
of indicators which will graphically depict to the user when a significant
change has occurred in the manner in which the system is responding to
changes in market personality. Additionally, if warranted by indicator
observation, the system can be altered to automatically change variable
values when indicated by changes in the market.
In this manner one is able to observe what the results of the
system would have been had re-optimization occurred at regular, defined
intervals over specified input values.
Developmental History
When I began designing systems for currency trading in TradeStation
several years ago I was quick to notice that the optimal variables which
controlled the system equations would vary greatly from one contract month
to another. My initial methodology involved an early range breakout system
for trading the currency markets whereby the system would place breakout
buy or sell stops slightly outside the early market range. Since the definition
of the early range was critical to system performance, variables were used
in the system to set the range by time of day, width of the early range,
and the proximity of the current price to extreme range when the early
range was defined.
It was soon obvious that the best settings for the variables
used to define the critical early range varied significantly from contract
to contract. Even averaging the variables over several contracts produced
only mediocre results. Obviously there was a characteristic somewhere in
the activity of the market that was fluctuating regularly which resulted
in the radical activity of the system. Also obviously, if the system was
to be profitable in the future, I was critical to get a handle on the root
of these fluctuations. One could always optimize the variables for each
contract and make the system look like the best thing around but we all
know by now that curve fitting is a quick way to overconfidence and a losing
system.
For months I analyzed every market parameter I could define - gaps,
average daily range, daily open to close, ratios of high to low to open
to close, tendency of a quiet day to follow a wild day, changes of market
activity around big report days, and so on. Although measuring these parameters
and using them to adjust the system variables was of some benefit to system
performance, I was still unable to achieve the consistency across all data
that I desired.
Then one day it dawned on me - the best way to evaluate the market
with respect to a particular system is the system itself! By running the
system against a defined subset of past market data using a defined set
of variables one could constantly monitor the performance of the system
across all variable settings. Properly programmed, the system could constantly
adjust critical variables to reflect optimum performance against recent
market data.
This technique operates in much the same fashion in which the pure
market technician assesses the market. The pure technician ignores all
fundamentals, confident that eventually all forces impacting on the market
will be reflected in price. In much the same way, a parallel user function
ignores all the myriad of technical forces in the market as they impact
the system and concentrates only on the net effect of these changes in
market characteristic on the system itself. Rather than trying to determine
which phase of market activity is impacting the results of the system,
we use the system itself to monitor changes in the market personality and
make system adjustments accordingly.
To accomplish this formidable task I created what I have chosen to
call the Parallel User Function Approach to System Design.
What is a "Parallel
Function"? In the
TradeStation platform, it is possible to program multiple subroutines, referred
to as user functions, which process data "outside" the main system
program, making the data generated in the function available to any program
which calls the function. A
"Parallel Function" is simply a TradeStation user function programmed
as a system. Although the actual programming is significantly more complicated
than that used to create an actual strategy, these functions allow the base
system to actually self test itself against current market conditions and then
utilize the prime system settings. In
this fashion the base trading strategy is able to change its critical parameters
and equations "on the fly" and therefore be much more responsive to
the regular changes in market personality that plague most non adaptive systems.
How Does It Work? Self
adaptive trading systems gain their advantage by continually testing themselves
against nearby market data using parallel function technology. The parallel
function is effectively running multiple systems in the background. By passing
multiple levels of system inputs to the parallel function the base strategy is
able to monitor the current behavior of the system against a wide array of input
patterns. A simple sort routine then enables the base system to utilize
the most effective input combinations for current trading. In
this fashion, no matter what outside forces are causing regular changes in
market personality, a self adaptive trading strategy utilizing parallel function
technology is able to effectively alter its signal generation process to create
a trading atmosphere more in line with the current market. Building
a Self Adaptive System The
first step is obviously creating the parallel function. Care must be taken to
assure that the function creates exactly the same returns as the base system -
otherwise the function is useless as a trading aid. Programming these functions
is more than a little complicated since many of the reserved words, such as buy,
sell, buy to cover, sell short, etc. may not be used when programming a
function. Next, within the
parallel function or in another linked function, you must set up a routine to
test all the system input combinations passed to the function from the base
program. If you intend to use for - next loops to test and sort these inputs
care must be taken to create the parallel function as a simple function as
opposed to a series function which refers to a previous value of itself
somewhere in the routine. Series functions are not able to be used in loops in
easy language. Then, usually
in the parallel function, it is necessary to set up a sort routine to isolate
the best performing set of system variables from the group passed to the
function from the base system. Finally,
one must create a routine within the base system to retrieve the sorted system
variables from the parallel function and properly replace these critical values
for the next series of trades. Retest
Options Critical to the
profitable performance of a self adaptive system are the parameters which govern
the periodic retesting of the system which immediately resets the system
variables. The timing of these retests and the range over which the system is
allowed to test itself will be critical to the eventual profitability of the
resulting strategy. In the
example coded provided on this site, you will notice a "reset" input
on the strategy for each parameter. In this example, I have allowed the system
to reset each of the three system inputs independently. It is obviously also
possible to reset all variables simultaneously. The
frequency of retesting and the range of inputs over which to run the test is
strictly dependent on the nature of the underlying system. While the example
system seems to respond to very frequent retesting of all parameters ( 2 - 5
days currently ) other longer term systems will probably respond more
effectively to a longer retest interval. I
would suggest that a manual walk forward system optimization exercise would be
the most efficient manner to determine the effective retest frequency and input
ranges for any system to which this routine is to be applied. Using
the Parallel Function as an Indicator A
parallel function may also be utilized as an indicator to plot the result of
multiple system settings. Those not wishing to take this technology to the fully
automated level may, in this manner, visually observe multiple settings of the
system and use this information to manually make appropriate changes to the
system being used for trading. 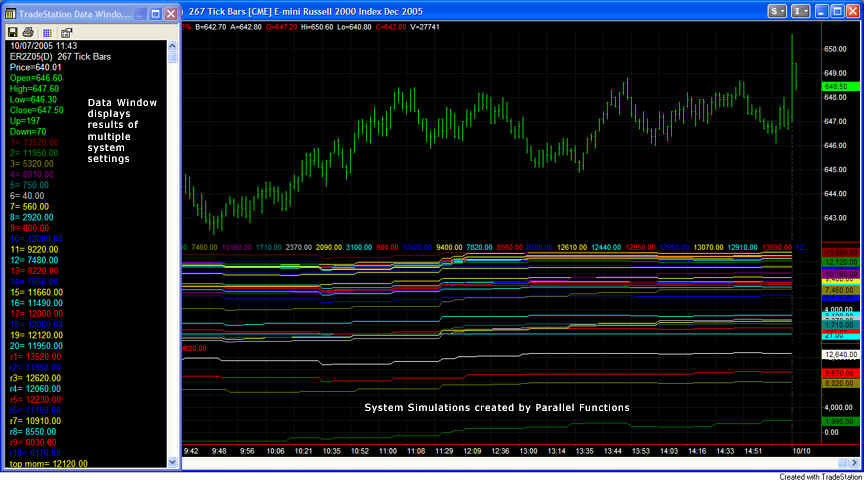
In
the chart above note the multiple plots below the price graph which display the
real time equity curve of 30 separate system settings. The data window to the
left of the chart reveals the current profitability of each graphed system
setting. Although this use
of parallel functions visually displays multiple system settings, the user must
realize that these plots are the result of fixed input settings and do not offer
the analysis of the range of system inputs that can be dynamically created by
the automated parallel function system. Limitations Parallel
functions are not a cure all for all systems. One must be certain that an
effective trading strategy lies behind the logic of the main system. A robust
system is a must before this technology should be applied. In
fact, this theory will probably only make an ineffective system worse. Additionally,
this is not a technology that can be applied as a "canned" function to
any system. It must be specifically designed for each system to which it will be
applied. Conclusions While
parallel function technology is difficult to apply and will not be suited to all
system designs, the advantages of using the system itself to direct appropriate
changes in critical system parameters are readily apparent when the technology
is properly designed and applied. More
information is available from the slide presentation used to present this topic
at the TradeStationWorld conference in Las Vegas, Nevada, September 30 - October
2, 2005.
Click here for further information.

|